Current Pediatric Research
International Journal of Pediatrics
An exploratory study on factors affecting the parental satisfaction regarding care of children admitted in pediatric department at Sree Balaji Medical college and hospital, chrompet, Chennai.
Tamilselvi D*
Department of Pediatric Nursing, Sree Balaji College of Nursing, Bharath Institute of Higher Education and Research (BIHER), Chennai, India
- Corresponding Author:
- Tamilselvi D
Department of Pediatric Nursing
Sree Balaji College of Nursing
Bharath Institute of Higher Education and Research (BIHER)
Chennai, India
E-mail: Tamilselvid@gmail.com
Received: 04 August, 2022, Manuscript No. AAJCP-22-68267; Editor assigned: 05 August, 2022, PreQC No. AAJCP-22-68267(PQ); Reviewed: 08 August, 2022, QC No. AAJCP-22-68267; Revised: 15 August, 2022, Manuscript No. AAJCP-22-68267(R); Published: 22 August, 2022, DOI:10.35841/0971-9032.26.8.1614-1619.
Parents’ perception of health care delivery that includes both experiences and satisfaction is an important component in health care evaluations, interventions and assessment of service quality. An objective of this study is to identify the factors affecting parental satisfaction regarding care of children. To find the association of factors affecting the parental satisfaction regarding care of children with selected socio demographic variables. Research approach is quantitative research, Research design exploratory study and convenient sampling technique is adopted in this study. Result of this study reveals that communication/ information had highest mean percentage (68.33%) followed by admission criteria (66.77%), then patient care (62.22%) and at last hospital environment (59.66%). Overall satisfaction level among parents of children satisfied level (%69(69.0%), more satisfied level 31(31.0%)
Keywords
Factors affecting, Quantitative research, Design, Demographic, Exploratory.
Introduction
Satisfaction only occurs when services meet or exceed the customer’s expectations or perceptions. For continued quality improvement, it is therefore imperative that health care providers know the customers’ perceptions and expectations. The Parental satisfaction is a interaction or combination of experiences, expectations and needs perceived by them, an important component in health care evaluations, interventions and assessment of service quality. Satisfaction with health services leads to better treatment adherence which improves health outcomes.
Objectives
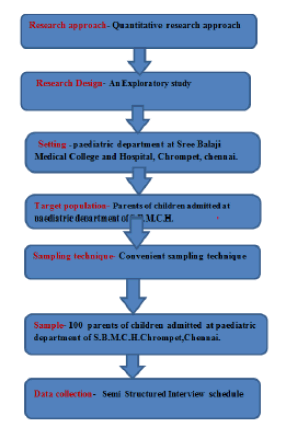
To identify the factors affecting parental satisfaction regarding care of children. To find the association of factors affecting the parental satisfaction regarding care of children with selected socio demographic variables (Figure 1).
Result and Analysis
| Overall level of satisfaction | Score |
|---|---|
| Unsatisfied | Below 24 |
| Satisfied | 25-48 |
| More satisfied | Above 49 |
Table 1. Criterion measure. Minimum score-24; Maximum score-72.
| Satisfied level f(%) | More satisfied level f(%) |
|---|---|
| 69(69.0%) | 31(31.0%) |
Table 2. Overall satisfaction level among parents of children.
| Domains | Satisfied level f(%) | More satisfied level f(% ) |
|---|---|---|
| Admission criteria | 67(67.0%) | 33(33.0%) |
| Hospital environment | 86(86.0%) | 14(14.0%) |
| Patient care | 77(77.0%) | 23(23. 0%) |
| Communication and information | 53(53.0%) | 47(47.0%) |
Table 3. Domain wise satisfaction level among parents of children.
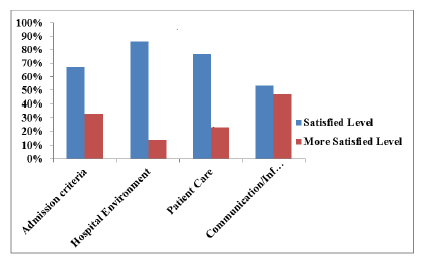
Figure 2 Shows that parents from admission criteria were satisfied 67% and 33% were more satisfied and from hospital environment 86% were satisfied and 14% more satisfied , patient care 77% parents were satisfied and 23%were more satisfied, in communication/information 53% were satisfied and 47% were more satisfied.
Association of total level of satisfaction among parents with selected demographic variables
| Socio demographic | Satisfied | more satisfied | Df x2 |
|---|---|---|---|
| variables | (f) | (f) | p-value- |
| Gender of parent | |||
| Mother | 51 | 15 | 1 |
| 6.211 | |||
| Father | 18 | 16 | 0.013 |
| Educational status of father | |||
| Informal education | 33 | 9 | 3 |
| 9.508 | |||
| 0.023 | |||
| Primary education | 14 | 5 | |
| Secondary/ higher secondary education | 13 | 15 | |
| Graduation and above | 9 | 2 | |
| Educational status of mother | |||
| Informal education | 31 | 4 | 3 |
| 12.092 | |||
| Primary education | 18 | 8 | 0.007 |
| Secondary/ higher secondary education | 15 | 15 | |
| Graduation and above | 5 | 4 | |
| Occupational status of mother | |||
| Govt. job | |||
| 3 | 8 | 3 | |
| Private job | 4 | 2 | 10.843 |
| 0 .013 | |||
| Labourer | 2 | 0 | |
| Housewife. | 60 | 21 | |
Table 4. Significant association tables (p<0.05-significant,p>0.05-NS).
Significant association of domains with the selected demographic variables
| Socio demographic | Satisfied | more satisfied | df |
|---|---|---|---|
| variables | (f) | (f) | x2 p-value |
| Occupational status of father. | |||
| a. Govt. job | |||
| 4 | 7 | 3 | |
| b. Private job | 6 | 0 | 8.64 |
| 0.034 | |||
| c. Labourer | 2 | 0 | |
| d. Farmer | 55 | 26 | |
| Occupational status of mother | |||
| a. Govt. job | 7 | 5 | 3 |
| b. Private job | 13 | 10 | 2.937 |
| 0.041 | |||
| c. Labourer | 11 | 6 | |
| d. housewife | 26 | 8 | |
Table 5. Association of admission criteria with selected demographic variables (p<0.05-significant,p>0.05-NS.
| Socio demographic variables | Satisfied (f) | more satisfied (f) | df x2 p-value |
|---|---|---|---|
| Informant | |||
| a.Mother | 51 | 15 | 1 |
| 6.211 | |||
| b.Father | 18 | 16 | 0.013 |
| Educational status of father | |||
| a. Informal education | 31 | 4 | |
| 3 | |||
| b. Primary education | 18 | 8 | 12.09 |
| 0.007 | |||
| c. Secondary/ higher secondary education | 15 | 15 | |
| d. Graduation and above | 5 | 4 | |
| Occupational status of father. | |||
| a. Govt job | 9 | 3 | 3 |
| 9.648 | |||
| b. Private job | 17 | 6 | 0.002 |
| c. Labourer | 26 | 5 | |
| d. Farmer | 34 | 0 | |
Table 6. Association of hospital environment with selected demographic variables (p<0.05-significant, p>0.05-NS).
Association of patient care with selected demographic variables (p<0.05-significant,p>0.05-ns).
| Socio demographic variables | Satisfied (f) | more satisfied (f) | df x2 p-value |
|---|---|---|---|
| Occupational status of mother. | |||
| a. Govt job | 5 | 6 | 3 |
| b. Private job | 4 | 2 | 8.059 |
| c. Labourer | 2 | 0 | 0.045 |
| d. Farmer | 66 | 15 | |
| Family monthly income in (Rs). | |||
| a. <5000 | 31 | 4 | 3 |
| b. 5000-10000 | 20 | 1 | 14.846 |
| c. 10001-15000 | 19 | 12 | 0.002 |
| d. > 15000 | 7 | 6 | |
Table 7. Significant association of communication/information with selected demographic variables (p<0.05-significant, p>0.05-NS).
| Sociodemographic variables | Satisfied (f) | more satisfied (f) | df x2 p-value |
|---|---|---|---|
| Parent’s Age (in years) | |||
| a. 20-30 | 22 | 30 | 2 |
| 6.525 | |||
| b. 31-40 | 20 | 14 | 0.038 |
| c. 41-50 | 11 | 3 | |
| Occupational status of mother. | |||
| a. Govt. job | 2 | 9 | 3 |
| b. Private job | 3 | 3 | 8.708 |
| 0.033 | |||
| c. Labourer | 2 | 0 | |
| d. Housewife | 49 | 32 | |
Table 8. Significant association of communication/information with selected demographic variables (p<0.05-significant,p>0.05-NS).
Conclusion
As it is found in present study communication/information had highest mean percentage (68.33%) followed by admission criteria (66.77%) ,then patient care (62.22%) and at last hospital environment (59.66%) , %) Overall satisfaction level among parents of children satisfied level (69(69.0%), more satisfied level 31(31.0%) . The specific actions should be taken like child's sleep should not be interrupted, noise free environment and create the familiar and secure environment.

